Guides
What a connectivity rank tells you about a domain (and what it doesn't)
How harmonic centrality turns the Common Crawl web graph into a connectivity rank, how to read the number, and why it is not traffic or quality.
Domain insights · Open data · A more connected web
Enter a domain to see its live DNS records, HTTP headers, redirects, WHOIS data, SSL certificate and technology, plus its connectivity rank and linked domains from the Common Crawl web graph.
Live checks
DNS, HTTPS and certificates, fetched on every visit
Open data
Built on the public Common Crawl hyperlink graph
Free for everyone
No account, no paywall: every domain has a page
The addresses, mail servers and name servers a domain publishes right now.
Whether the site answers over HTTPS, its redirects, headers and SSL certificate.
Where the domain stands among millions by harmonic centrality. Higher rank, better connected.
Which domains link to it and which it links to, explorable node by node.
Map of the Internet
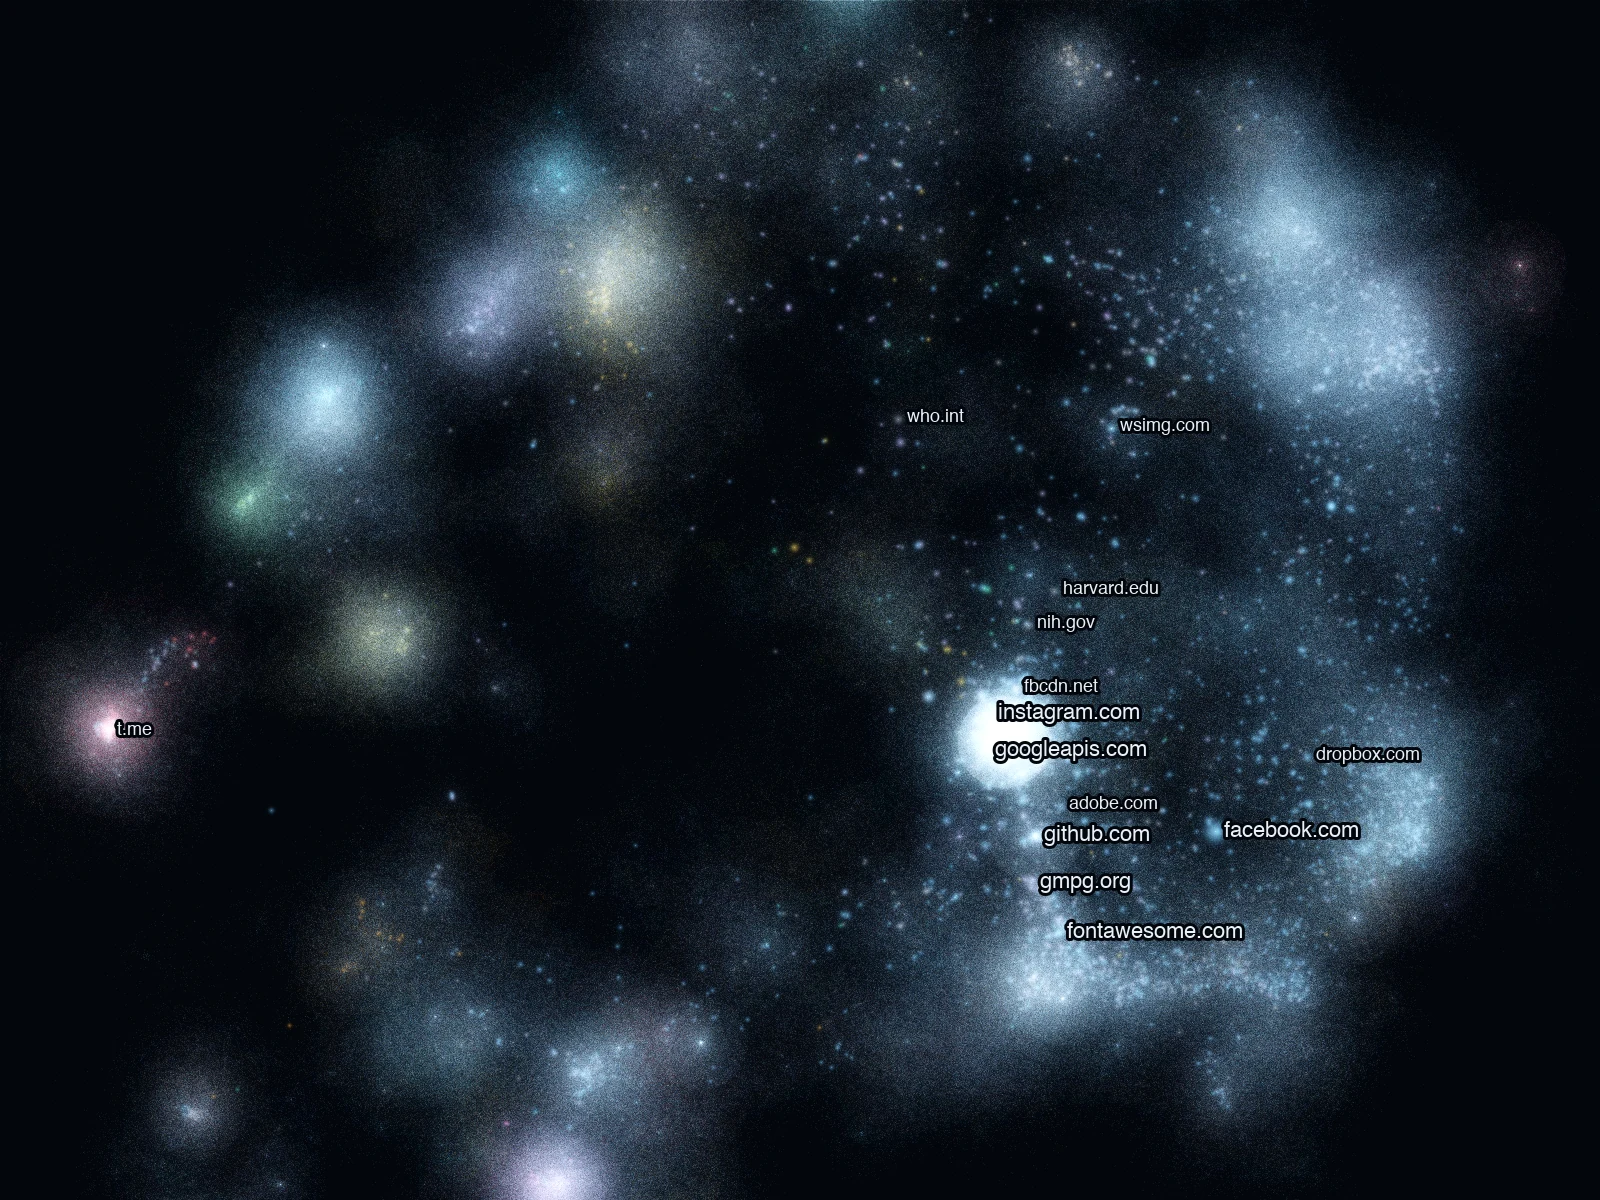
Every point is a domain from the Common Crawl web graph. The hubs glow at the centre, national webs gather in their own colours, and the long tail fills the dark around them. Zoom in, or search any domain to fly to its neighbourhood. Two more tabs map the 87,000 networks seen in BGP routes and the whole IPv4 address space, with your own network and address marked.
The Map of the Internet: millions of glowing points in coloured clusters, with the web’s biggest hubs labelled at its centre
Exactly what each figure on a StatsMyWeb domain page measures, where the underlying data comes from, and what is not covered yet.
What StatsMyWeb measures, where its data comes from, and what it does not claim to be. Worth reading before relying on anything you find here.
The single address for anything concerning this site: an error to report, a question about the content, or a request concerning your data.
Guides to reading the public facts about a domain: what DNS records, HTTP headers, certificates and link data mean, and how to check them yourself.
Guides
How harmonic centrality turns the Common Crawl web graph into a connectivity rank, how to read the number, and why it is not traffic or quality.
Guides
What the six common HTTP security headers tell a browser, typical values, frequent mistakes, and how to check the headers any site sends.
Guides
Check when an SSL certificate expires in the browser, with openssl or curl: what notBefore and notAfter mean, and what an expiry date does not tell you.
Guides
Find out who owns a domain with WHOIS and RDAP: what a lookup still shows, what GDPR redaction hides, and how to reach an owner when details are hidden.
Each domain report fetches DNS records, HTTPS reachability, response headers, the redirect chain, WHOIS (RDAP) data, the SSL certificate, meta tags, robots.txt, detected technology and a preview of the site, on every visit and for any domain. Each check fails on its own, so one slow source leaves the rest of the report in place.
StatsMyWeb serves the whole Common Crawl domain-level hyperlink graph, snapshot cc-main-2026-jul-aug-sep: about 133 million domains and 2.15 billion links between them. Every domain in it has a connectivity rank, its harmonic-centrality position among those 133 million, and a page in the Web Graph Explorer listing its incoming and outgoing links. The Map of the Internet lays out the 10 million best-connected domains by who links to whom.
It is free and needs no account. The methodology page explains what is measured and where it comes from; the guides show how to read each figure.